


")


")


There’s a performance chart for every basic phase of flight. Pilots use them to determine how fast they can fly, for how long and how much runway they’ll use doing it, among other things. The tables, graphs and charts in the performance section of your typical personal airplane’s flight manual or operating handbook purport to identify for you, beforehand, the answers to the how fast and how long questions. Which gets embarrassing when we run the numbers and roll off the end of the runway anyway.
When that happens, it might be pilot error—maybe you made a mistake tracing your pencil along a curve on a performance chart. It also could be because your calculations are all wrong, not because you made a mistake—did you interpolate when you should have extrapolated?—but because the numbers you came up with are more advisory than exact. How can this be? There are several reasons. What can you do about it? There are several answers. Let’s explore.
Environmental
Perhaps the most likely reason performance chart results turn out to be wrong on occasion has nothing to do with the calculations, unless you think “garbage in, garbage out” is a math error. Instead, the results we obtain from those charts can be in error because we fail to correctly assess local conditions.
For example, just about any takeoff performance chart for a CAR 3/Part 23 airplane will include a disclaimer to the effect that the results presume a paved, dry, level runway. The notes appended to the particular table, chart or graph explain how to adjust the calculations for the conditions you encounter. An example from Cessna’s takeoff performance table for the T206H Turbo Stationair says “decrease distances 10% for each 10 knots headwind” or on a “dry, grass runway, increase distances by 15% of the ‘ground roll’ figure.”
Because these performance calculations are general in nature, there’s no correction factor supplied when, for example, the runway features a one-percent uphill grade, or the grass runway hasn’t been mowed recently because it’s too wet. What about taking off with a gusty wind, or with underinflated main-gear tires? Few, if any, performance charts, tables and graphs tell us.
Of course, how much our airplane weighs can be a major factor in determining its performance. In our experience, it’s rare to find one that weighs less than its paperwork states, and even rarer to find a passenger who correctly gives their own weight. Unless we weigh each piece of luggage, along with the tools, oil, cowling plugs, flashlights and charts stowed in various nooks and crannies throughout, we can’t know exactly how much the airplane weighs. Interestingly, it’s probably easier to figure out the arm and moment of the supplies you keep in the luggage compartment than it is to accurately gauge their weight.
And as the sidebars “It’s Not A Dry Heat” and “Your Fuel Weighs More (Or Less) Than You Think” below detail, the atmospheric conditions in which we’re operating also affect aircraft performance. Yes, some of this is pedantic and some of it is negligible, but it all adds up, and the end result on a high, hot, humid day can have us rolling off into the weeds on landing or takeoff as we wonder what went wrong.
Technique, And Wear And Tear
Referring back to the Turbo Stationair performance charts, another note states, “Short field technique as specified in Section 4.” That portion of the airplane’s documentation includes a nine-step checklist with specific values for wing-flap extension, power settings, fuel flow and airspeed. One detail is to accelerate in a slightly tail-low attitude. Another is to hold the brakes until power is stabilized.
While it’s arguable whether a rolling takeoff can be considered a maximum-effort short-field procedure, what if we’re concerned about the prop picking up gravel? Or if the runway is sufficiently soft that we really don’t want to stop to do the run-up specified before releasing brakes? In both of these examples, the takeoff roll will be longer than “the book” says. How much longer likely is negligible but depends on how far we let the airplane roll before setting takeoff power and how hard the runway is. We’re not aware of any personal airplane manufacturer’s documentation that goes into this kind of detail.
So far, we’ve focused on takeoff technique. What about landing? How quickly do you pull off engine power when entering the flare? Do you slowly retard the throttle, immediately yank it back to idle or leave a little bit of power on because the engine has been idling rough lately and may quit on the landing roll-out?
For that matter, what about your crosswind technique? Do you touch down in a slight crab or employ the wing-low method, aligning the fuselage with the runway centerline? Which did the test pilots use?
In addition to the environment we fly in and the technique we use, the airplane itself has a lot to say about how well it performs. It should not come as a surprise that an older one that’s picked up a few dings along with a lot of dirt hidden in tight locations, or one with a propeller that’s had a few nicks filed out of it, isn’t going to perform as well as a brand-new one. An in-service engine can comply with all the various health measurements we use—including cylinder compression, fuel flow, oil pressure, etc.—and not achieve its rated power.
As an airplane ages, it likely will lose a knot or three from the removal and installation of inspection covers, cowlings and the like, plus normal wear and tear on landing gear doors, control surfaces and even the wings’ leading edges. All these factors and more likely will impact the airplane’s performance, sometimes making it unable to meet various aspects of the manufacturer’s expected performance.
What To Do About It
Having read this far, you’ve probably figured out that you need to be careful when using book performance numbers to make decisions. Even if your technique is good, even if the runway is truly flat and even if the airplane has a fresh engine, it’s unlikely you can obtain the same takeoff roll as the factory pilots, or get down and stopped on the local golf course’s fairway. What to do? Add some fudge factor, of course. One question is, how much to add? One answer is how lucky do you feel?
We’d guess a typical pilot on a typical runway with a typical airplane can typically obtain something like takeoff performance within 125 percent of what the book says. In other words, if the book says 1000 feet of ground roll is required for takeoff under the existing conditions, you can do it in 1250 feet, thanks to the slight upslope, the dragging brake and the fact you haven’t practiced maximum-performance takeoffs lately. That’s not bad, actually, and we’d take it and run with it. What about a margin for error? Does that extra 25 percent buy you the padding you need in case the trees on the far end are taller than 50 feet? Maybe, maybe not.
So, add another 25 percent, making your performance expectation 150 percent of book. If the charts say you need 1000 feet, you know you can get up and out or down and stopped with 1500 feet of runway under the same conditions. Use that extra 50 percent as your “correction” to the book figures to ensure the airplane will safely perform the way you want it to. Because it’s likely your uncorrected performance calculations are wrong, not because of something you did, but just because.
It’s Not A Dry Heat
As every student pilot learns, relatively high temperatures result in reduced performance while low ones improve it. The important factor is the air’s density, which affects how much power an engine produces or how much lift the airfoils designed into our wings and propellers generate. One factor often missing from temperature-related performance calculations is humidity.
According to the FAA’s Pilot’s Handbook of Aeronautical Knowledge (PHAK), small amounts of water vapor suspended in the atmosphere “may be negligible under certain conditions, but in other conditions humidity may become an important factor in the performance of an aircraft.” That’s because “water vapor is lighter than air; consequently, moist air is lighter than dry air,” which means it’s less dense.
Also according to the PHAK, relative humidity “is expressed as a percentage of the maximum amount of water vapor the air can hold,” which varies with temperature. “The higher the temperature, the greater amount of water vapor that the air can hold….”
“Pressure, temperature, and humidity have a great influence on aircraft performance because of their effect upon density,” the PHAK continues. Importantly, it concludes, “There is no rule-of-thumb or chart used to compute the effects of humidity on density altitude, but it must be taken into consideration. Expect a decrease in overall performance in high humidity conditions.”
Your Fuel Weighs More (Or Less) Than You Think

It’s an article of faith that a gallon of aviation gasoline weighs six pounds. That’s basically correct at ISA temperatures, but we’re not always flying in the standard conditions of 59 degrees F/15 degrees C, and the weight of a gallon of avgas is a function of its density. Of course, density changes with temperature.
In fact, a gallon of avgas in ISA conditions weighs 6.01 pounds, which is a negligible difference. But take that gallon to, say, northern Canada in January, where temperatures can be well below freezing, and it gets heavier. According to a table published by Measurement Canada, the nation’s agency “responsible for ensuring accuracy in the selling of measured goods,” a gallon of avgas weighs 6.43 pounds at -40 degrees C/F. At 40 degrees C/104 degrees F, avgas weighs 5.81 pounds per gallon.
Turbine engine fuels exhibit similar qualities. Measurement Canada’s correction factor for Jet A and Jet A-1 results in a gallon starting at 6.7 pounds actually weighing 7.03 pounds at -40 C/F, and 6.54 at 40 degrees C/104 degrees F.
Importantly, fuel density determines how much energy a gallon contains. Also, turbine fuels available outside the U.S. will have different densities and, therefore, different weights and performance by volume. And if you’re flying with mogas, per-gallon densities can vary even more, especially if ethanol is allowed.
Which Way The Wind Blows
A constant element of runway performance calculations is the wind component—its velocity relative to the runway and how it affects the airplane’s groundspeed when taking off or landing. Too little wind and a short runway may be unusable unless we offload some weight. Too much wind from the wrong direction can be greater than the airplane’s demonstrated crosswind component, leaving us with a choice.
At many airports, there’s no automated equipment or human observer to measure and report wind velocity. Windsocks and other devices give us its direction, but pilots landing at those airports may not know the wind’s true velocity and effect on their attempt until reaching short final.
When taking off, it’s generally a lot easier to determine the wind’s heading, though big, gusty swings at right angles to the runway often mean a coin flip is as good a method of choosing a direction in which to take off as any other.
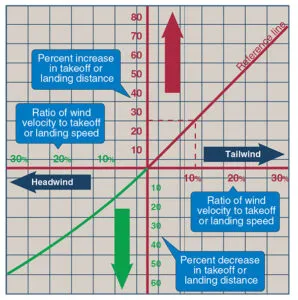
That’s usually not a problem unless the runway is marginal for the conditions. As the chart at right demonstrates, if you think you have a headwind but it shears to a tailwind, there will be a major impact on your takeoff performance.
This article originally appeared in the April 2021 issue of Aviation Safety magazine.
For more great content like this, subscribe to Aviation Safety!

In my youth I once took off on a golf-lawn quality but slightly wet runway that was sufficient by book figures, only to make it over the fence and adjacent road with shaking knees and at barely enough height not to touch crossing cars. Based on that experience the 25% increase should probably go to the difference between ordinary pilots and test pilots alone. This is even more true for landings where most of us won’t smash their plane in for optimum performance like a pilot will do.
Ages ago Sporty offered a slide rule calculator to adjust for various factors not contained in more sparse manufacturer’s take-off tables.
Takeoff xw component is worthy of more than a coin toss for some…for single engine acft reliant on differential braking, p-factor correction in the same direction as xw correction may exceed rudder available at full power and require delay of full power until sufficient rudder authority develops with airspeed on the roll, with the impact of a longer roll than if you had the luxury of firewalling on brake release with an opposite xw.
For the typical US aircraft with this issue, a right xw is helpful, a left xw is not (if your engine turns the “wrong way” a left xw is helpful)…and even if sufficient rudder is available, less rudder deflection is less drag to work against.
Once you begin flying transport category planes you soon realize just how true this article is about performance charts for normal category planes. Planes certified prior to 1979, those charts are even worse. Having computer/IPad based programs/apps make getting performance numbers for the jet I fly so much easier than using the spaghetti charts in the AFM/POH.
I think that a more accurate title would be
‘ Why your performance Chart Calculations may be Wrong ‘
My experience over the last 35 year, of flying 5 models of Cessnas, from a 1961 C175 to a 1999 C127R , I’ve found that the performance tables,[ not graphs that Piper uses], are quite accurate, for rate of climb, cruise speed and fuel consumption.
The tables only list 3-4 aircraft weights and altitudes so a pilot does have to interpolate between 2 values.
Extrapolating puts your data outside the tables, so you a now a test pilot….not a good idea.
The largest variation in aircraft performance is for gross weight and density altitude.
The POH lists percentages for all the other mentioned variables, which, generally work ok.
An engine/propeller is airworthy as long as it makes the static power, also listed in the POH.
Cruise performance is then a matter of proper rigging and any drag reduction STC mods.
As far are fuel weight variation with temperature, my 50 gallons of fuel weight difference from 59 degrees to 100 degrees F, is only 8 pounds, not worth any concern.
More good stuff from the Editors and the commenters. I always regarded POH data as best case values obtained by professional test pilots with factory fresh planes, and tried to act accordingly. The effects of density altitude on performance can be impressive. On a 95F/70 dew point day most single engine Cessnas have marginal takeoff and climb at gross weight.
>> take that gallon to, say, northern Canada in January, where temperatures can be well below freezing, and it gets heavier.
No. I know what you’re trying to say, but this statement is incorrect. If you TAKE six pounds (a gallon) of fuel from Arizona to Alaska, it’s weight will not change at all. It will still weigh exactly six pounds. It’s volume will shrink and it will become less than a gallon of fuel in the cold, but weight is constant and so is the energy content.
If you BUY a gallon of fuel in the frozen north, it will be heavier than a gallon of fuel purchased in the desert, and it will contain more energy. (The engine consumes fuel by the pound, not by the gallon.)
The other thought experiment is to take full fuel tanks (let’s say 100 gallons) from the ground in Phoenix where it’s 120dF, and take it up to 23,000 feet where it’s well below zero. The fuel will shrink in the tanks, but the weight will be the same (less the amount consumed in the climb).
Perhaps more on-point for this article, a full tank of fuel in Anchorage will weigh more (measurably more) than a full tank of fuel in Tucson.
I learned this the hard way when I ferried my Grumman TR2 from Spokane to Sacramento. 2.8 hours from takeoff, the engine quit cold, and the sight gauge for the right tank read empty. The left gauge was not indicating much fuel remaining, so I switched tanks and prayed I would make it into Redmond, Oregon on fumes. The charts for fuel planning were somewhat optimistic. I revised them to plan 3 hours to dry tanks after that.